An ever-changing picture
Updated December 2019
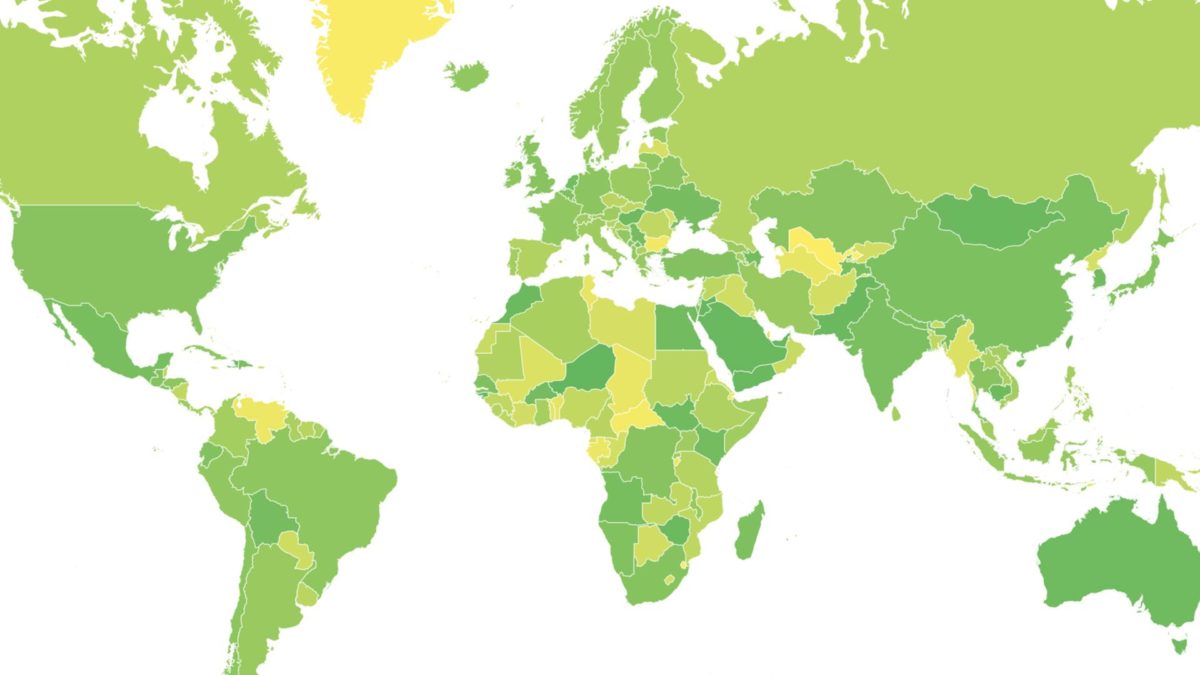
See the evolution in renewable power using the map below to review over two decades of data, specific to individual countries from all corners of the globe. Slide the year rule to reveal either the percentage share of renewables in electricity production around the world or the annual growth – from year to year – in renewable electricity capacity by country. Choose which to view from the dropdown menu above the map.
The clean energy sector continues to make inroads into power markets around the world. As technologies become more efficient, costs continue to decline, and governments, along with regional authorities, are increasing their commitments to decarbonization for example, by introducing net-zero emissions commitments.
Renewable energy generation capacity installed globally grew by 174.5 GW in 2018, to a total of 2,356 GW, according to figures published by the International Renewable Energy Agency (IRENA) in 2019.
The 8% increase, continues an eight-year trend of 8%-9% growth. – IRENA
As a proportion of overall generation, renewable capacity accounted for more than a quarter (25.6%) of generation in 2018, according to the latest figures from Enerdata’s energy yearbook.
The dynamic map above shows the countries that are leading the way. Norway remains the global leader, with its long-established hydro-based power system ensuring almost all of the electricity generated in the country comes from renewables.
In Sweden, renewables produced 55% of all electricity generated. Elsewhere in Europe, Portugal stands out as a renewables pioneer, with 52% of generated electricity coming from renewables, primarily from hydropower and wind.
Germany, closely associated with the shift to renewables, has rapidly grown its renewables from 5% in 1996 to 36% in 2018.
Around the world, countries where renewables account for over half of electricity generation include Canada, Brazil, Colombia and New Zealand – all countries where hydroelectricity has an important role in power generation.
Hydro also plays an important role in many Asian and African countries, including Egypt, Ethiopia, China and Indonesia.
Growth Areas
The cost of offshore wind fell by almost a third (32%) in 2018, and it is set to spread from its North Sea roots to markets all over the world as turbines get bigger and more powerful, and floating platforms enable them to be deployed in deeper waters.
Meanwhile, solar remains the technology with the largest annual capacity additions. It has reached grid parity in an increasing number of markets, and continues to grow strongly outside of China, where a slowdown is currently dragging the global growth number down.
However, China continues to grow, adding 119 GW of capacity in 2018, to reach a world-leading total capacity of 1,640.5 GW.
Renewables growth was strongest in markets such as Portugal (11.2%), with Spain, the U.K., Brazil and Australia also seeing a marked increase in the proportion of power generated by renewables.
Renewable Sources
Globally, hydro accounts for the largest share of the global total. However, growth rates for hydro are almost flat – less than 2% in 2017 – as many of the best sites are already taken.
There is currently 1,295 GW of installed hydropower capacity, along with 120 GW from pumped storage.
It was in wind and solar power that the most impressive growth rates were seen. Between them they now account for 7.47% of global power generation, and the amount of solar photovoltaic (PV) capacity grew by 98 GW, around a quarter, in 2018, while the amount of wind energy capacity increased almost 10%, to 564 GW.